

Data Science is one of the most sought-after fields today. If you throw a stone randomly at a working professional, it will most likely hit a Data Scientist or an ML engineer.
The amount of data generated every day and the computing powers that we have built over the years has made the data field enormous. The growth and opportunities for a data engineer or a statistician are highly lucrative today. And almost every organization puts significant effort into making data-driven decisions.
But, if you step back and ask if data has got all the power to know the unknowns— perhaps no.
The fact that data helps us make better decisions is indisputable. However, can “data” alone set us free to get answers to the hypothesis made? Probably not.
Data is often regarded as a tool to uncover the truth. But data can only produce evidence to eliminate your hypothesis and not select them. The data underlying the experiments can help us indicate what could be “useful” but not what is “right.”
So, how do you make data “useful”?
Assumptions about Data
The United States military undertook research to reduce the casualties in their aircraft during World War II. So they worked on a plan to identify the damage received to the aircraft that returned from the war. The red dots were the place of bullets received by the aircraft and were found to be the wings and tails of the aircraft. They came to a conclusion to rebuild these vulnerable areas as they were the most affected parts.
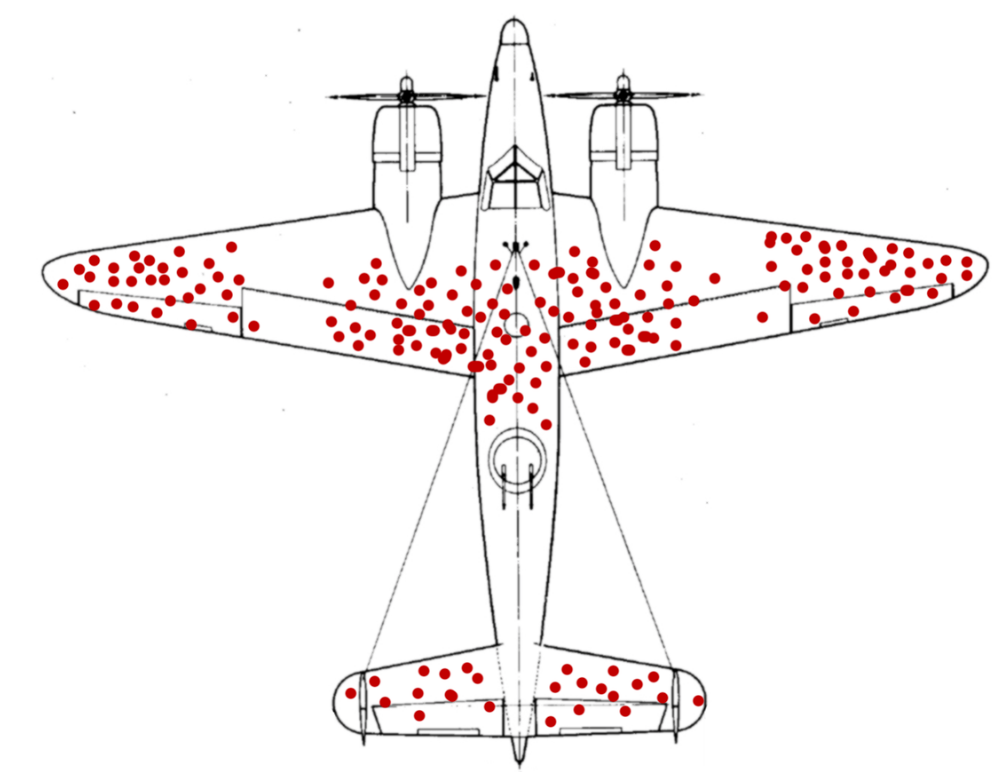
Abraham Wald, a mathematician, stepped in and suggested that they were wrong. He said the red dots represented the damage to the plane that could sustain and was still able to fly back.
And the vulnerable part was actually the ones with no points, which is the engine that did not survive the hit and hence did not return back to the base.
The above example reflects how incomplete data cannot give objective outcomes to our assumptions. In other words, you may only see what you want to see.
We believe that data tells us the story of what happened. But only if they are recorded. And, sometimes data fails to survive, and we fail to bring in the unrecorded data to our assumptions.
Correlation does not always imply Causation
Well, this is a Statistician’s favorite.
Correlation measures the connection between two things on how they are closely related to each other. Whereas causation goes even deeper and says whether the change of the value of one variable causes the change in the value of another.
Let me explain.
Steam from a boiling pan containing water is caused by the effect of heating the pan. Here, we know that one thing (heating— a cause) causes another thing to happen (steaming— an effect).
To understand correlation, consider the data on ice cream sales and sunburn rate during summer. It is found that both of these events are correlated. That is, whenever there was an increase in the sales of ice cream, there was an increase in sunburn.
So, does this mean eating ice cream causes sunburn?
Of course not.
It just so happens that, when it is summer, people crave more for ice creams, and hence the increase in sales and so is the rate of increase in sunburn caused by the hot sun.
This is not causation.
Our conception of how things work is how our brain tricks us. In most trivial cases, this might not be a tricky thing. But when it comes to understanding bigger aspects of things, especially if you are dealing with far more complicated facts derived from the underlying data of massive amounts, one might conceive correlation to be causation.

But what differentiates correlation and causation is explainability.
The Black Swan
Who doesn’t love surprises? But only if they are good. Especially the unknown unknowns in business is always a double-edged sword. We often go by data for assumptions and decisions, hence relying too much on it. Well, that’s not bad. However, events around the world come with their share of randomness.
In one of his books, statistician and professional trader Nasim Taleb explains how the world is often dominated by randomness that has fooled us in many situations.
He quotes this example where statements were made regarding the stock market that it has never been down more than 13% during one single day since its existence of about 33,000 days. Hence it cannot go down more than that in a day. Well, 19th October 1987 proved this assumption wrong, and the Dow Jones average crashed to 22.6%. This is called the black swan problem.
No amount of observations of white swans can allow the inference that all swans are white, but the observation of a single black swan is sufficient to refute that conclusion.

There’s one more black-swan event that almost every human is now familiar with. Covid.
Black swans are often rare and unpredictable; however, as a practitioner of practical and reliable solutions based on data, one should always keep it in hindsight about the black swans in data. Detecting these anomalies at the right time can help you with course correction and get you on track.
Final Words
Though data is useful for our decisions, it comes with its own limits and limitations. Taking data at its face value sometimes reflects the bias that is ultimately a part of every technology we use today. And sometimes, people building algorithms based on data are unaware of the biases posed by it. To reduce these biases, creating the right guardrails becomes imperative considering the deep impact of data on people’s lives today, especially in the life science, medical, and financial fields.
Read AI-generated summary
- If you throw a stone randomly at a working professional, it will most likely hit a Data Scientist or an ML engineer.
- So they worked on a plan to identify the damage received to the aircraft that returned from the war.
- The red dots were the place of bullets received by the aircraft and were found to be the wings and tails of the aircraft.
- And the vulnerable part was actually the ones with no points, which is the engine that did not survive the hit and hence did not return back to the base.
- It just so happens that, when it is summer, people crave more for ice creams, and hence the increase in sales and so is the rate of increase in sunburn caused by the hot sun.


 systems")
