You probably know the saying, “location, location, location.” But just knowing a location is good isn’t the same as understanding why it’s good, or if it will stay that way in a few years.
The difference between relying on instincts and having real answers is what sets apart the commercial real estate teams making smart deals in 2026 from those having to explain bad ones. This guide is for brokers, investors, asset managers, and leasing teams who want a clear, practical explanation of how location intelligence can help their deals.
Key Takeaways
- Location intelligence combines POI data, location data, and real estate data into decisions you can defend.
- In 2026, commercial real estate fundamentals are getting stronger, which means making a wrong site selection choice is more costly than before.
- It supports four core jobs: investment research, site selection, risk mitigation, and geographic targeting.
- You don’t need data scientists or specialists from the field to get started. Trying out one deal with one dataset is enough to see the benefits.
What Is Location Intelligence?
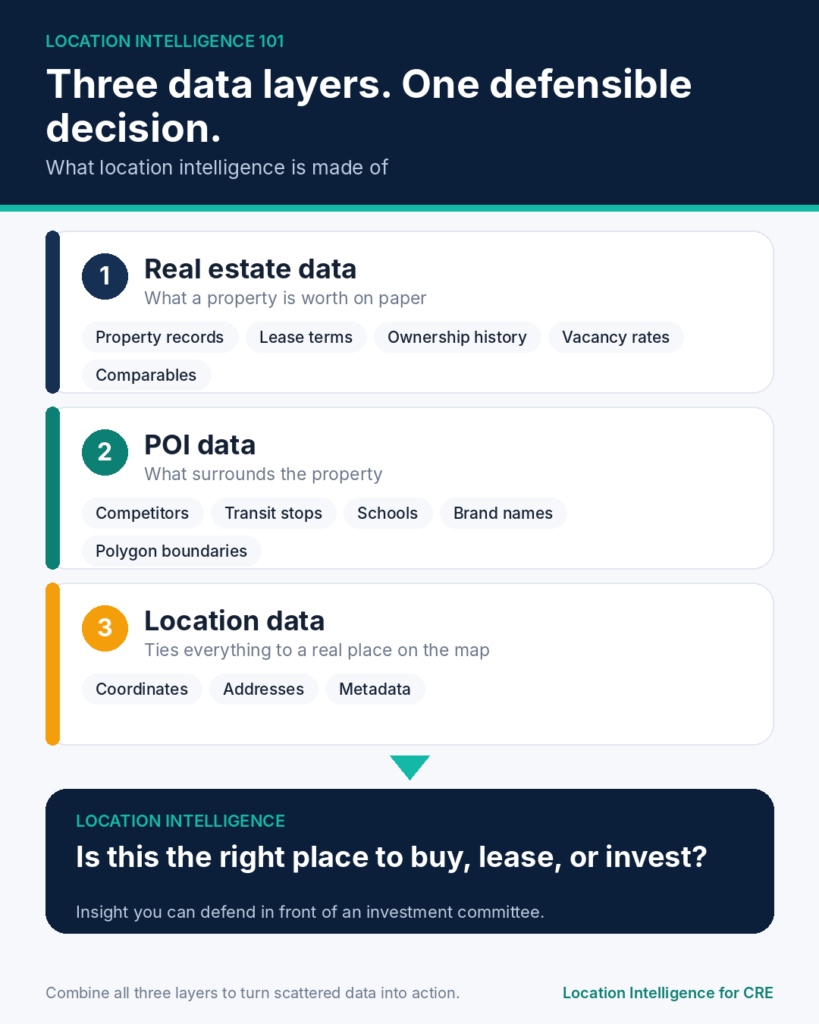
If you ignore the buzzwords, location intelligence is simple. It gathers scattered data about a place, the people nearby, what surrounds it, and market trends, then turns it into useful information you can act on.
You can think of it in three parts:
- Real estate data tells you what a property is worth on paper.
- POI data tells you what surrounds it.
- Location data ties it all to an actual place on a map.
When you combine all three types of data, location intelligence helps you decide what actions to take based on that information.
If you want to see how this works with a real portfolio, Mobius offers location intelligence solutions designed exactly for that purpose.
Why Location Intelligence Matters for You in 2026
Location has always been key in commercial real estate. That hasn’t changed. What’s different now is the amount of commercial real estate data supporting that idea, and this year’s numbers prove it.
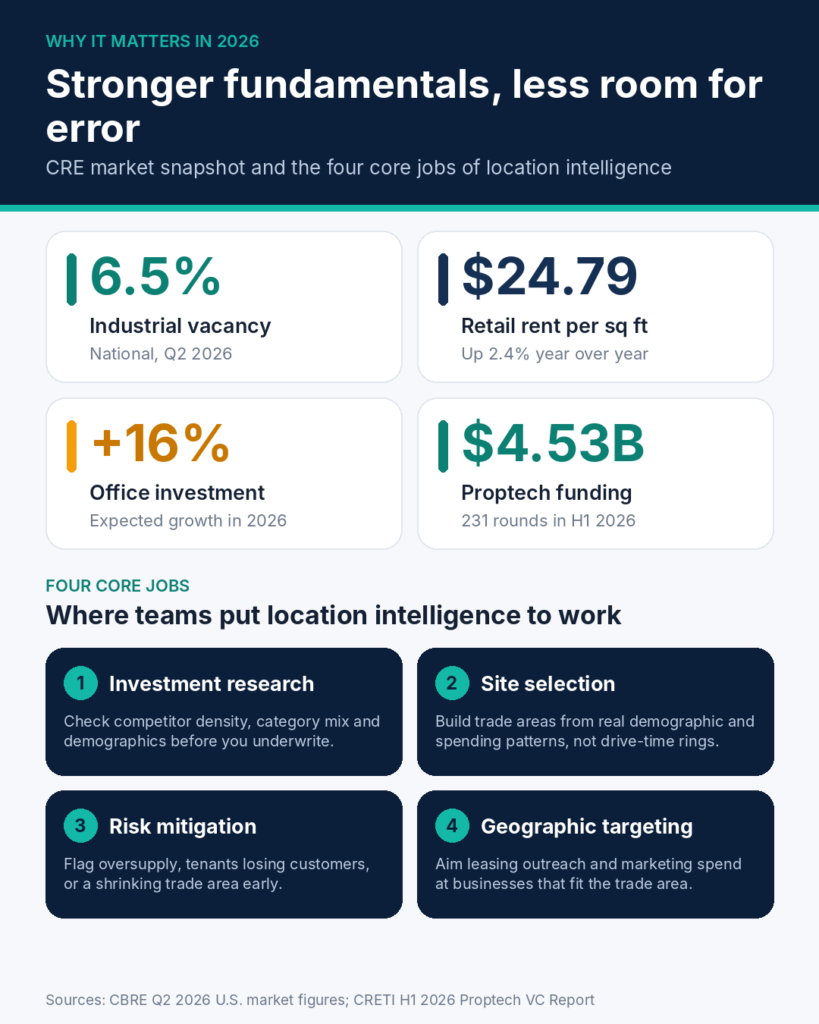
The market direction of the commercial real estate industry is shifting. Industrial vacancy dropped to 6.5% nationally in Q2 of 2026. Retail rents reached about $24.79 per square foot, 2.4% higher than a year earlier. However, the available space remained tight. Office investment is also expected to grow 16% in 2026, pointing to a gradual recovery. (CBRE, Q2 2026 U.S. market figures)
PropTech is seeing significant investment too. Funding reached about $4.53 billion across 231 rounds in the first half of 2026. Much of the activity is centered on technology that supports real estate operations and decision-making. (CRETI, H1 2026 PropTech Venture Capital Report)
But that doesn’t mean assumptions are okay. In fact, tighter markets leave less room for mistakes when making a site selection decision.
Using real commercial real estate data lets you spot a declining trade area before you get a lease renewal notice. If you skip this step, you often find out only after sales numbers reveal the problem.
AI is also playing a bigger role. Many firms are trying AI-driven underwriting this year, but these models are only as accurate and reliable as the location data they feed on. If the data is weak, the results will be too, no matter how advanced the algorithm seems.
The Three Data Types You Need to Know
You don’t have to be an expert in the field to use commercial real estate data. You just need to understand these three types.
POI Data
Points of interest include competitors, transit stops, schools, and anything else nearby that affects demand for a property. Good POI data is more than just a pin on a map. It covers brand names, categories, and even area outlines, also called polygon boundaries.
If you’re curious what’s actually inside a dataset like this before you commit to it, our POI data page breaks down what you get, and the data schema lays out every attribute, so you know exactly what you’re working with.
Location Data
It is the broader layer of POI data. Location data includes coordinates, addresses, and details or metadata that link a physical place to real information. With location data, you can ask specific questions about an address instead of making general hypotheses about a zip code.
Real Estate Data
Real estate data includes property records, lease terms, ownership history, vacancy rates, and comparables. By itself, real estate data shows what has already happened in the real estate market. When you combine it with location data and POI data, you get commercial real estate data that actually shows what might happen next.
Traditional Site Selection vs. Location Intelligence
Here’s the difference in plain terms, and it’s the gap location data analytics is built to close.
| Factor | Traditional Site Selection | Location Intelligence Approach |
| Speed | Weeks of manual research | Hours, sometimes minutes |
| Basis | Gut feel and broker experience | Real estate data, POI data, demographics |
| Data freshness | Static reports, updated quarterly or less | Refreshed regularly, closer to real time |
| Defensibility | Hard to justify to a committee | Data-backed and easy to defend |
| Risk | Problems surface after signing | Red flags caught before you commit |
| Scale | One site at a time | Dozens of sites compared at once |
This doesn’t replace your instincts as a broker. Instead, it gives your instincts a solid foundation.
Where Location Intelligence Gets Used in CRE
Most teams use it for four main tasks. Here’s how each one works in practice.
Investment Research
Before investing, you want to know more than just the price listed. Location intelligence lets you check competitor density, category mix, and demographic trends around a property before you underwrite it, instead of relying only on the seller’s figures.
That matters because two properties might look the same on paper, similar square footage, similar cap rate, and still be headed in very different directions once you consider what’s happening around them.
Site Selection and Trade Area Analysis
Every property has a trade area, which is the zone where it attracts customers or tenants. If you get this wrong, everything else built on that decision is likely to be wrong too.
In the past, trade area analysis used simple drive-time rings, just circles drawn around a point on a map. In 2026, most teams build trade area analysis using real demographic and spending patterns, which gives a more accurate picture than just drawing a circle.
Site selection data pulls it all together for you:
- Demographics
- Competitor density
- Lease comparables
- Market saturation
If you’re a retailer, you use site selection data to choose your next location. If you’re an investor, you combine location analytics and site selection data to spot properties that seem good on paper but are actually in declining trade areas.
Risk Mitigation
Every deal comes with some risk, but the bigger problems are often the ones you don’t see coming. Location data analytics can help flag those risks early, from an oversupplied submarket filled with similar properties to tenants losing customers to competitors or a shrinking trade area as the local population changes.
This doesn’t replace a proper inspection or title search. Instead, it adds an early warning system based on up-to-date commercial real estate data, not just an old report.
Geographic Targeting for Leasing and Marketing
Location intelligence isn’t just for acquisitions and underwriting. It also helps leasing and marketing teams reach the right audience.
Instead of sending the same message to every business in a city, geographic targeting lets you focus your outreach on businesses that fit a specific trade area.
If you’re leasing space in a growing suburb, geographic targeting can show which types of businesses – like a gym, medical office, or fast-casual restaurant – are most likely to succeed there. It uses nearby POI data and demographic trends. This gives you a stronger pitch than a generic listing email.
Marketing teams use the same approach for demand generation, narrowing their budget to specific areas instead of the whole city. Better geographic targeting means less wasted spend and more signed leases.
Turning Data Into Decisions: Location Analytics
The first step is collecting data. The next is making sense of it, and that’s where location analytics helps.
Location analytics turns raw location data and real estate data into scores, dashboards, and forecasts you can actually use, instead of just another spreadsheet that gets ignored.
Location data analytics moves a step further by adding historical trends to current numbers. It helps you answer questions like:
- Is this shopping center’s tenant mix strengthening or weakening over time?
- Is a competitor’s new location pulling demand away from yours?
- Which properties in your portfolio are quietly underperforming?
You need a lot of time to answer these questions by hand. With the right location data analytics platform, you get answers in minutes, and it can flag site selection data that deserves a closer look before a deal goes to committee.
See It Work
Numbers on a slide are one thing. Watching your own portfolio run through live location data analytics is another. Try out a free data demo and see how it works with your own data.
What This Looks Like in Practice
Imagine a regional retail chain choosing between three empty anchor spaces in the same city. On paper, the lease terms look almost the same.
But when you run each site through the same analysis, things look different. One site is in an area already full of similar stores. Another has great demographics, but there’s a big fast-casual competitor just two blocks away. The third has less competition and a customer base that matches the chain’s usual shoppers.
That’s the kind of difference you won’t see with just real estate data. Site selection data and location analytics are designed to catch these issues before you sign a lease, not after.
Quick Answers to Common Questions
Location intelligence combines POI data, location data, and real estate data to answer a specific question: Is this the right place to buy, lease, or invest? It turns scattered information about a property and its surroundings into insight you can defend in front of an investment committee.
GIS is the foundation that helps you organize, visualize, and analyze location-based information. It typically requires specialist skills. Location intelligence is the business layer that is built on top. It is designed for brokers, investors, and leasing teams who need concrete answers to make decisions, not map layers that GIS provides.
Location intelligence replaces rough drive-time circles with trade areas that are built from real demographic and spending patterns. You can compare the density of a competitor, market saturation, lease comparables, and customer fit across many sites at once, rather than evaluating one site at a time.
A trade area is the geographic area where a property draws most of its customers or tenants from. Defining it accurately lets you size real demand. But when you get it wrong, every projection built on top of it is likely to be wrong too.
It can help you spot market-level early signs of trouble, like an oversupplied market, tenants losing customers to competitors, or a shrinking trade area. It does not replace inspections or title searches. Instead, think of it as an early warning system that gives you more context before you decide.
No. Office, industrial, multifamily, and mixed-use teams use it too, for site selection, underwriting, and risk flagging. Leasing and marketing teams also use it for geographic targeting, so outreach goes to the businesses most likely to succeed in a given trade area.
Conclusion
In commercial real estate, the old advice still stands: location matters most. What has changed over time is how well you can understand it. With fast-changing markets and less room for error in 2026, decisions based on current, fresh data are easier to defend and more likely to be profitable than decisions based on instincts and guesswork.
Location intelligence doesn’t ask you to abandon your experience. It enhances it by showing what is around a property, who actually uses it, and where the trade area is heading before you decide to put your money into it.
You don’t need to change your entire data setup to start seeing the benefits. Start with one deal or one underperforming asset. Run a real trade area analysis using actual POI and location data. Then compare the results to what your instincts said. Usually, the difference between the two is where you’ll find the real opportunity or risk.
In commercial real estate, those who understand a location better than anyone else usually come out ahead. Sharper trade area analysis helps you get there faster.
If you have a portfolio you’d like to stress-test, or a market you’re not sure about, get in touch with the Mobius team, and we can look at the numbers together.
Read AI-generated summary
- ” But just knowing a location is good isn’t the same as understanding why it’s good, or if it will stay that way in a few years.
- The difference between relying on instincts and having real answers is what sets apart the commercial real estate teams making smart deals in 2026 from those having to explain bad ones.
- It gathers scattered data about a place, the people nearby, what surrounds it, and market trends, then turns it into useful information you can act on.
- Using real commercial real estate data lets you spot a declining trade area before you get a lease renewal notice.
- Good POI data is more than just a pin on a map.